A churn diagnostic, run on data shaped like yours

Find out which customers are about to leave, and why, before they do

KeelShift reads customer event history, ranks the behaviours actually driving churn, and puts a cost against each one, in plain business language rather than a score nobody can question. Pick your industry and we will email you the full report.

Get my sample report

Free, no account, no data upload. Report arrives by email in about a minute.

10 business days
From data access to report and readout
EU-processed
Your data never leaves the EU
Every driver attributed
Ranked causes, not a black-box score

How the demo works

No upload, no setup, nothing to install. Pick your industry and we send you a complete diagnostic report produced on a synthetic dataset built to behave like a business in that space.

1

Pick your industry

Telco subscriptions or VAS mobile gaming. Each one has its own realistic, deliberately noisy synthetic dataset behind it.

2

The real pipeline produced it

Each report came out of the same pipeline a Design Partner engagement uses: data validation, behavioural feature engineering, model selection against held-out customers, then per-driver attribution so the output ranks causes instead of scoring customers.

3

Read it, then decide

A branded PDF with churn drivers, risk cohorts and prioritized recommendations, written for a commercial audience. If it holds up, the next step is running it on your data.

What's inside the report

Not a dashboard dump. A short, readable diagnostic built for a business audience.
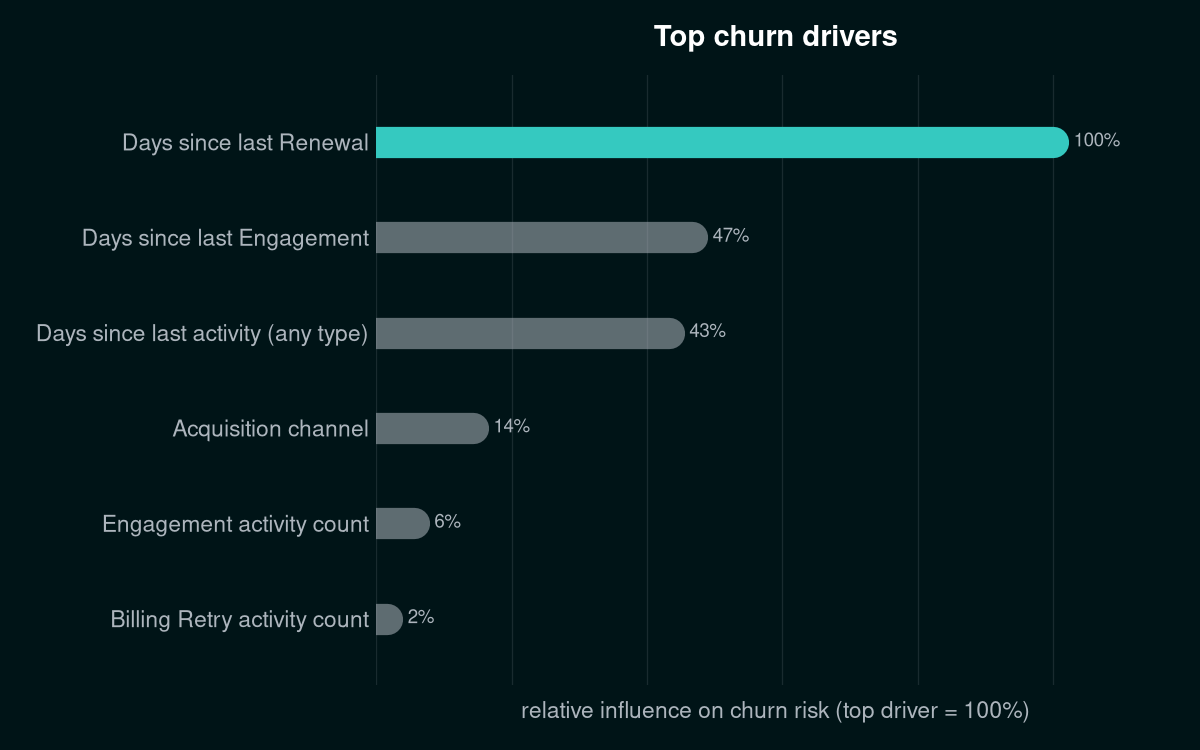
Sample chart ranking the top churn drivers by relative influence on churn risk
  • Executive summary of who is churning and what it is costing
  • The top signals actually driving churn, ranked and explained in plain language
  • Risk cohorts: which segment of customers is most likely to leave next
  • Concrete, prioritized recommendations, not just charts
  • Full methodology section for anyone who wants to check the work

What "explainable" means here. The model does not just score customers. For every prediction, the contribution of each behavioural feature is measured and reported, so the chart above is a ranking of causes with evidence attached to each line. Your data team can interrogate it. Your commercial team can act on it.

Before you enter your email

Three things worth being clear about.

The data is synthetic, on purpose

No customer of ours appears in these reports. Each dataset is generated to reproduce the messiness of a real book of business: probabilistic churn, uneven engagement, decoy signals. It is not toy data tuned to make the model look good.

Your email is not a mailing list

We send the report, and one follow-up asking whether you want this run on your own data. That is it. No newsletter, no sharing with anyone, and replying "no thanks" ends it.

Your own data stays yours

If you go further than the sample, work runs on hashed identifiers by default, is processed in the EU, and the data is deleted after analysis. On-premise is available where policy requires it.

Get your sample report

Pick an industry, enter your email, and the matching diagnostic PDF is on its way in about a minute.

Neither one exactly? Pick the closer of the two. The mechanics carry across recurring-revenue businesses, and we can talk through your specifics on a call.

Sample report only, built on synthetic data. We follow up once about becoming a Design Partner, and not again if you are not interested.

Want this on your own data?

Design Partners get the same diagnostic run on their actual data at first-mover terms. We then seal the prediction of who lapses next, declare the accuracy we expect in writing, and open it against your real churn 30 days later, before you commit to anything ongoing.

Book a 30-minute call

Prefer to write first? contact@keelshift.com